Do you want to find the root causes of a particular problem, but you don't know how to visualize it? This Fishbone Diagram Module will help you display your root cause analysis in seconds.
A fishbone diagram, or in other words ISHIKAWA diagram, is founded by Kaoru Ishikawa, a Japanese quality control expert. The fishbone model is also known as a cause and effect diagram because of its main purpose. You can use this diagram to identify all potential causes of a certain problem or event. You can categorize these causes to get effective and clear solutions.
This way, you can think about the reasons for the problem with your team members. Don't forget to encourage your colleagues to share their thoughts on the factors contributing to the emergence of a problem.
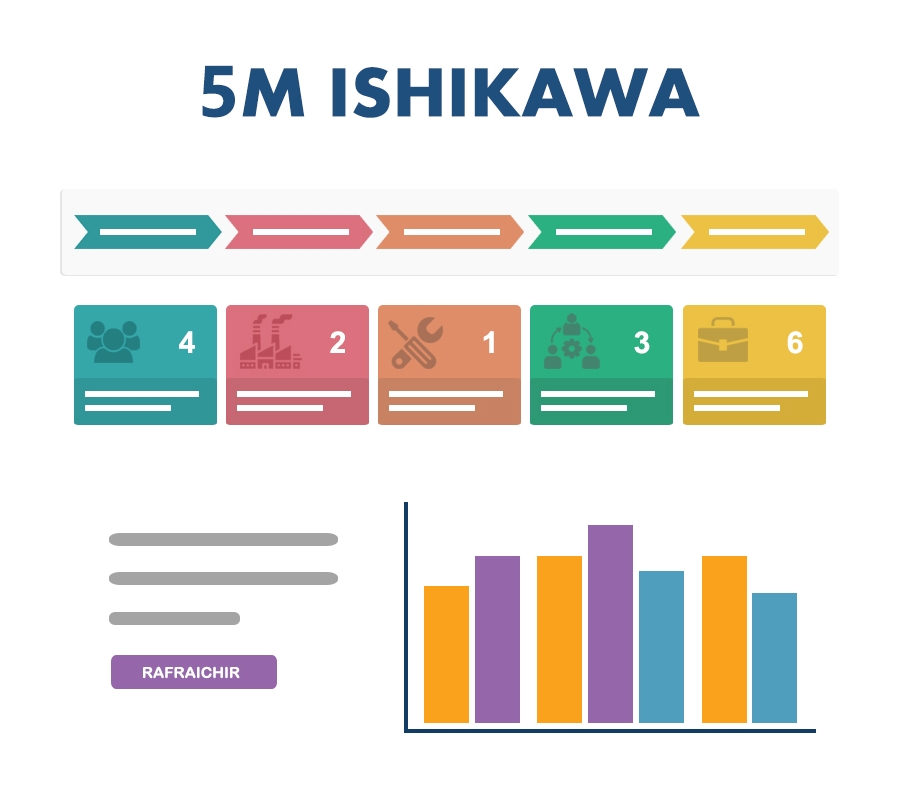
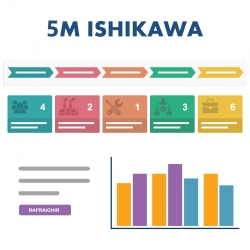
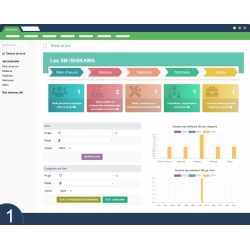
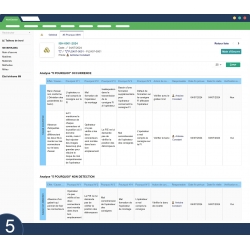
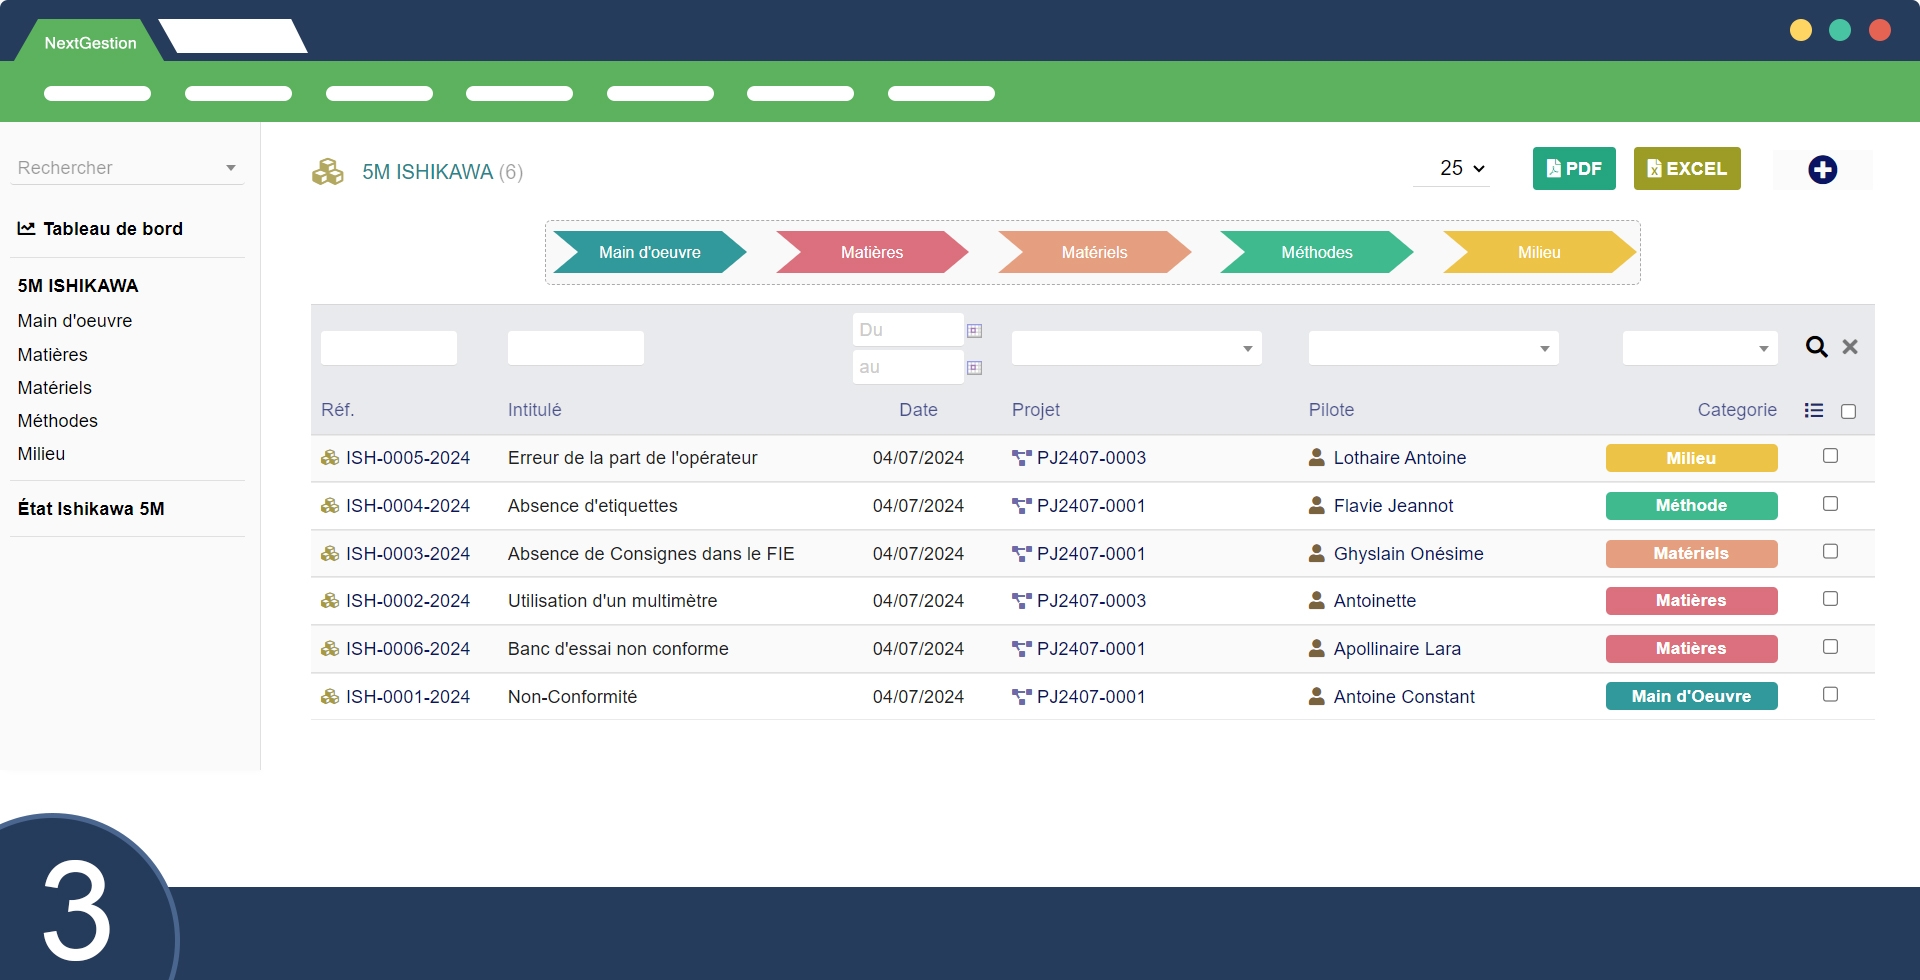
Features 5M ISHIKAWA Fishbone Diagram Module:
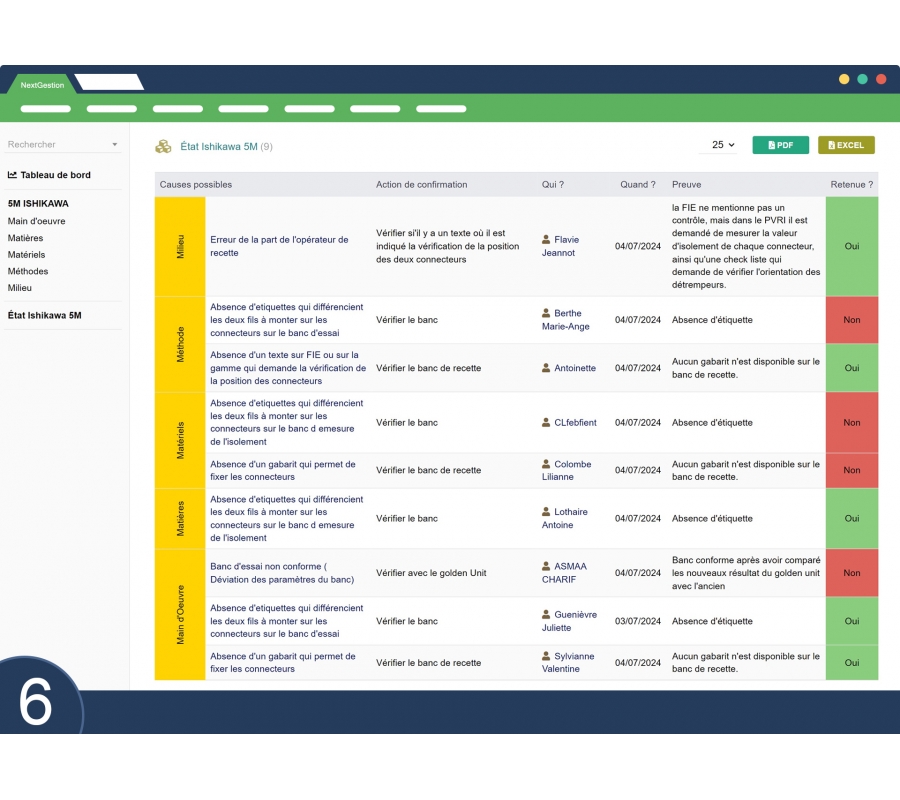
Our module allows you to list 10 different main causes in each of 6 categories.
These already existing categories are: Labor, Methods, Material, Machines, Environment.
You can rename the titles of existing categories according to your needs and the type of problem in the diagram used.
Why should we use a fishbone diagram?
When you focus too much on the problem itself, you risk not seeing the exact causes. But you need to reveal the minor issues first to see the big picture. This fishbone diagram can help you not only understand all the reasons, but also how and when they occur.
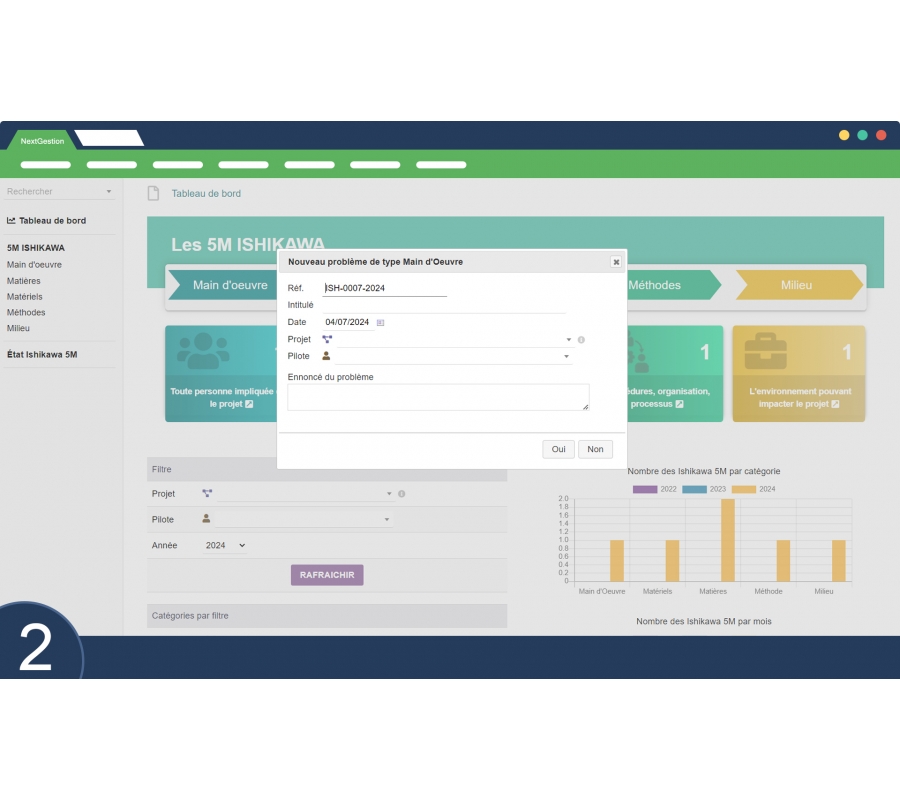
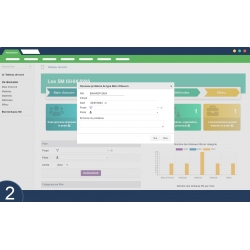
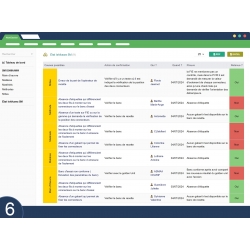
If you want to get effective solutions by creating this diagram, try to involve all parties such as your teammates or colleagues. If possible, first make sure your team agrees with you on the exact problem definition. Then, simply start adding new causes on your Excel fishbone diagram template.
After that, you need to correctly identify the categories or areas in which the main problem is involved. Now you can let contributors list their experiences on the issue separately for each category.
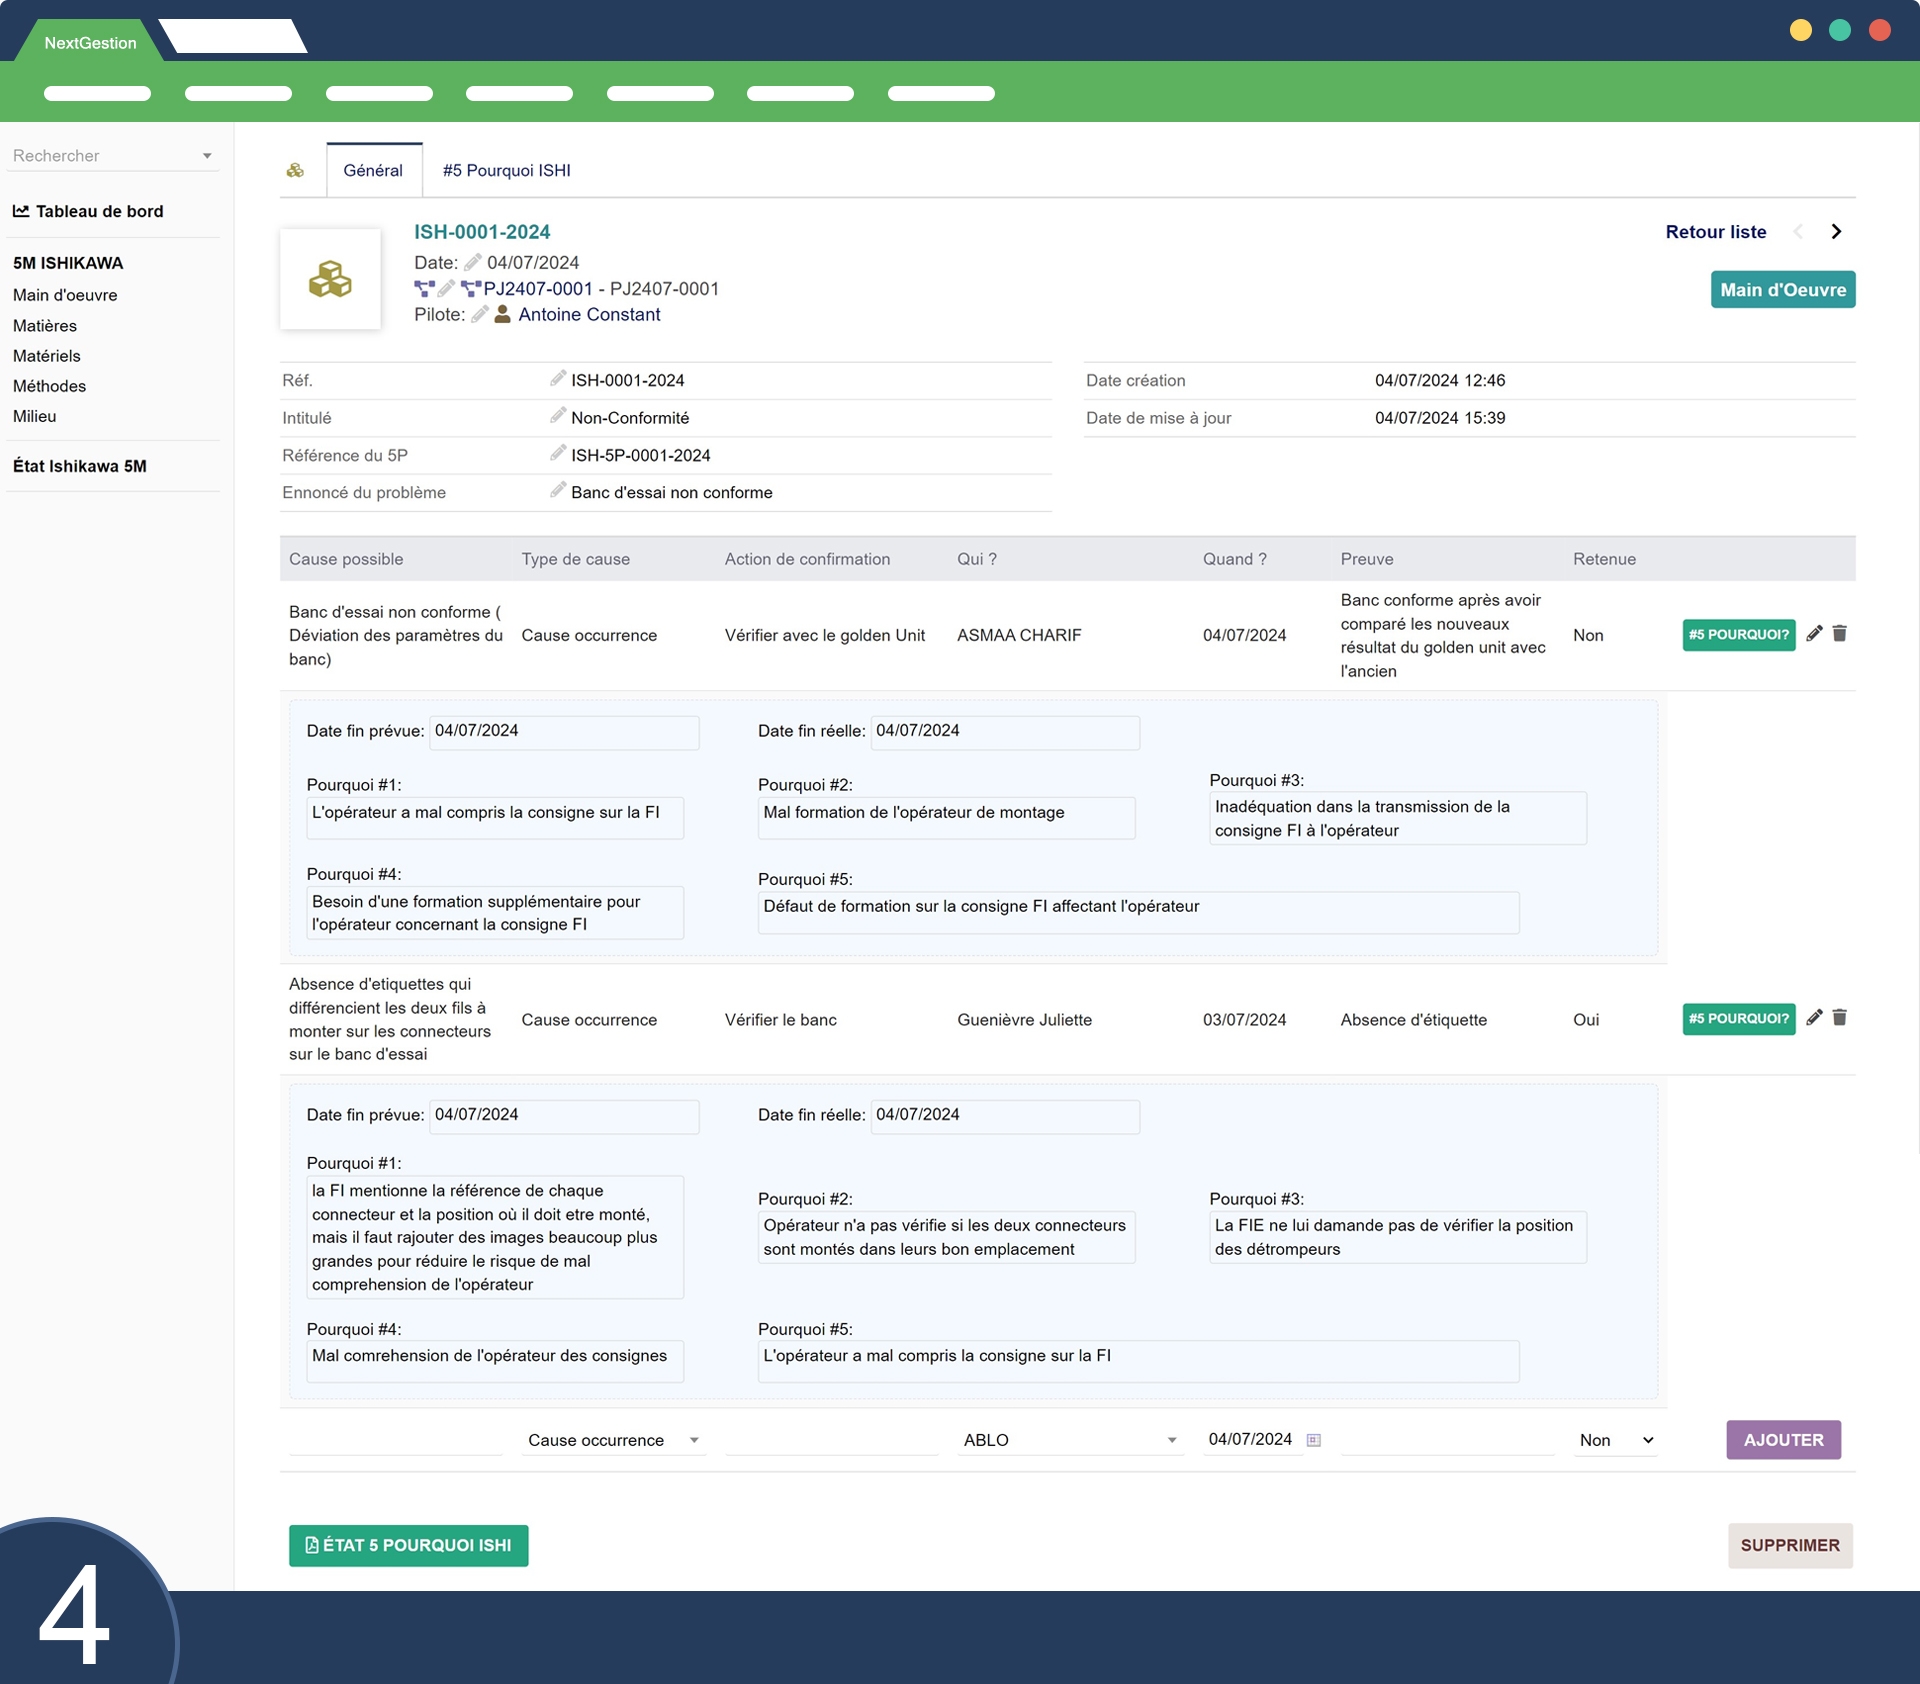
When creating a list, you should all ask a few questions to find the exact reason. The better question is “why?”» to get to the root cause of the problem.
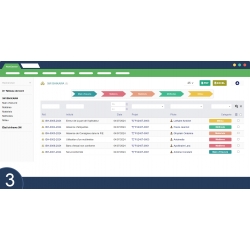
After collecting the list from each contributor, you need to check if the entire list goes into the right categories.
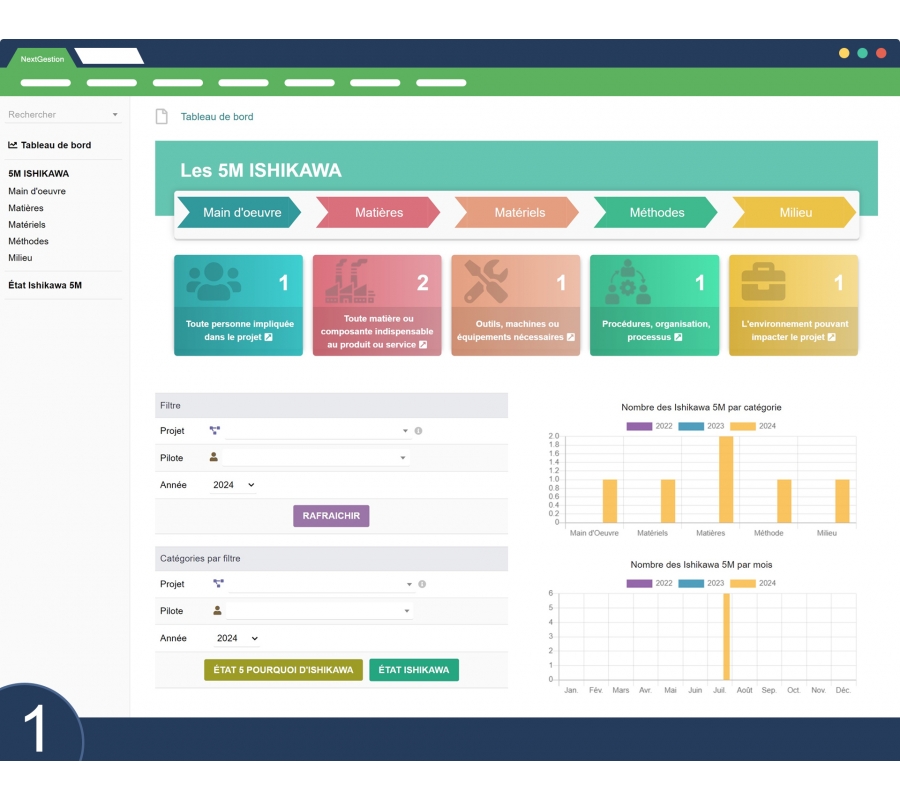
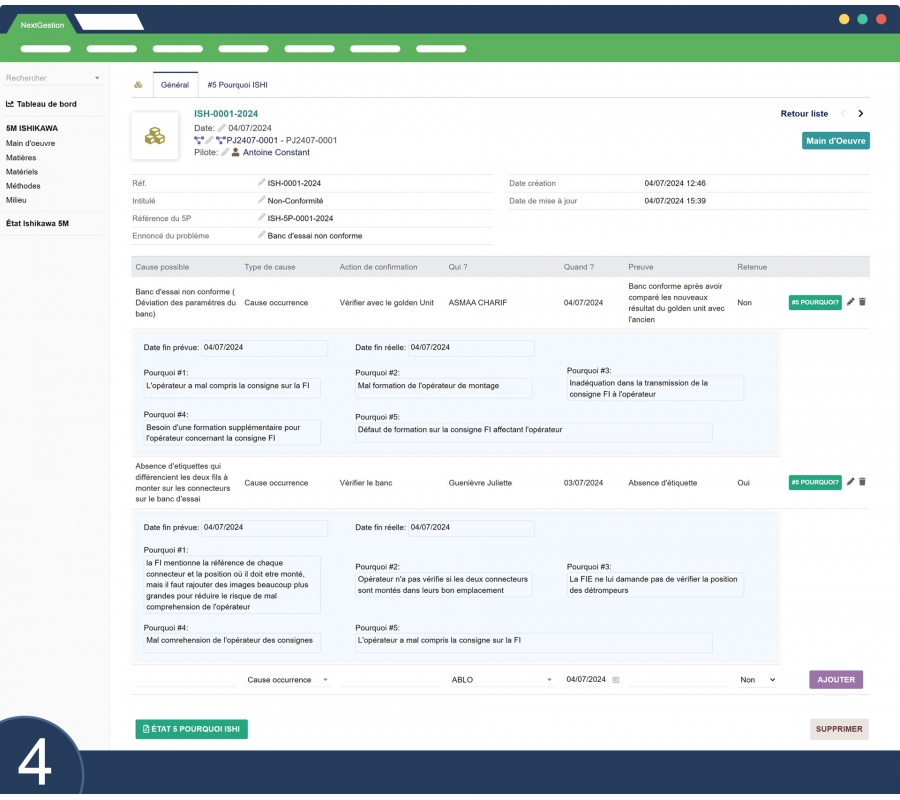
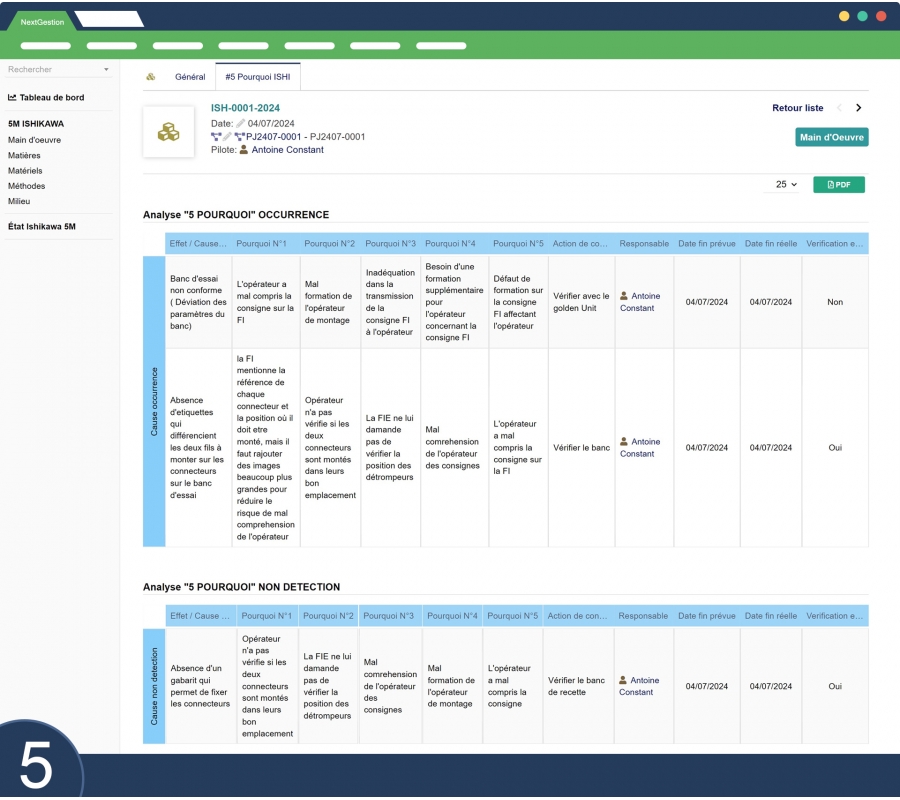
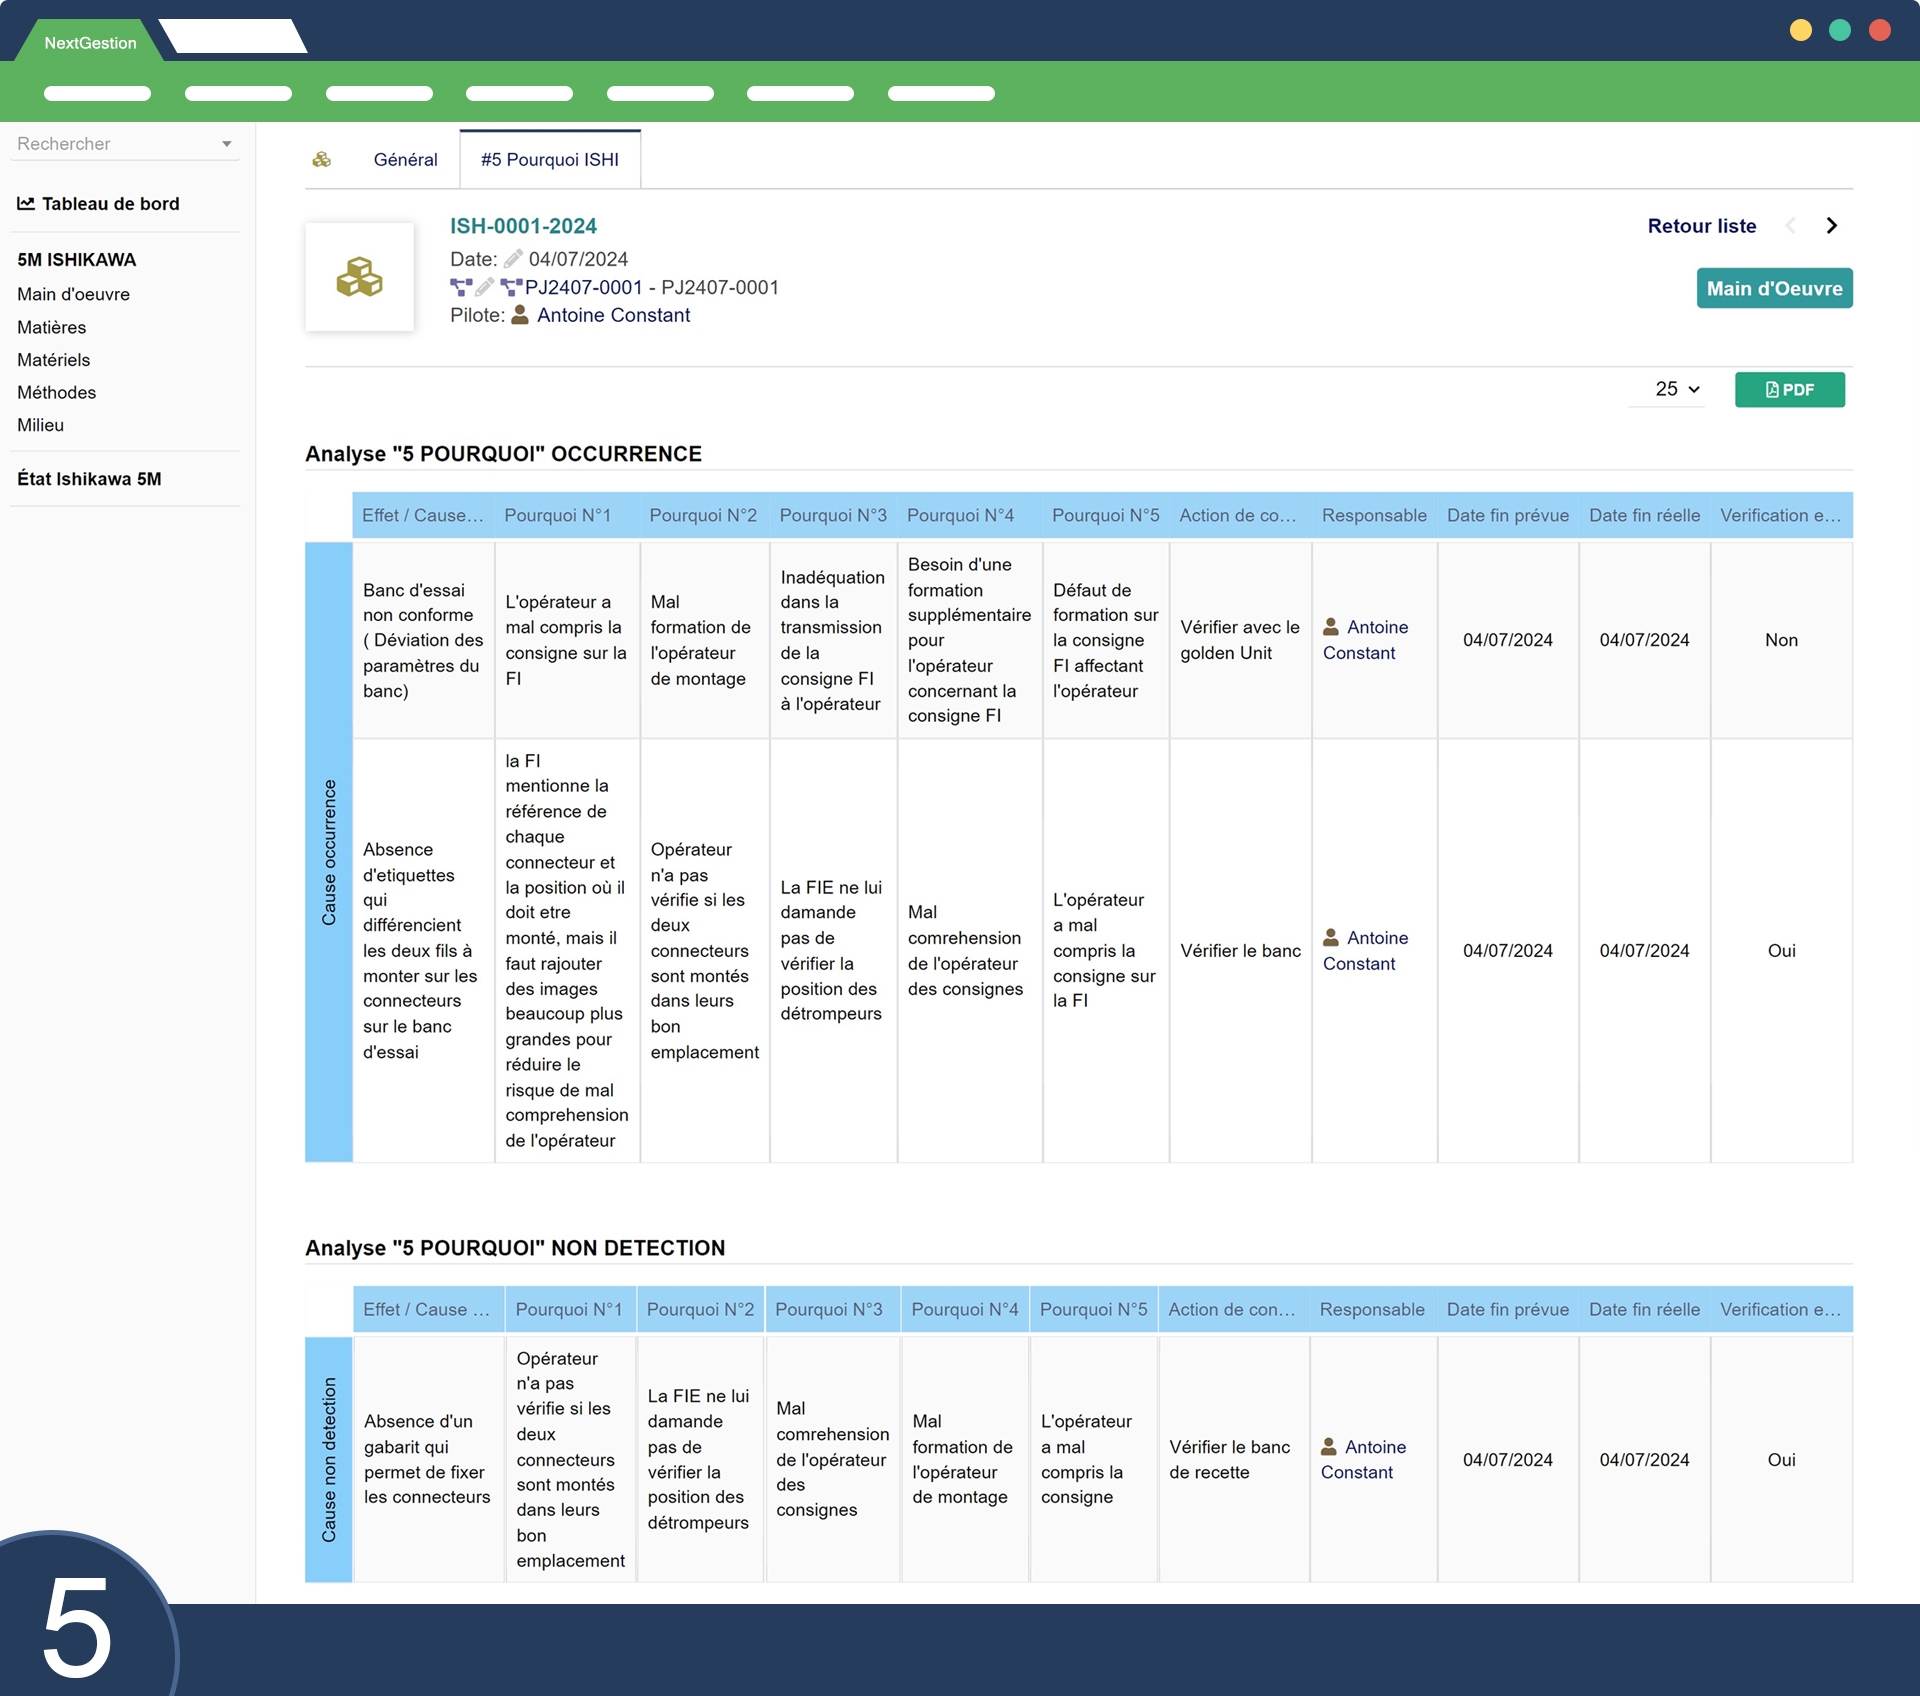
We have combined the 5Ms (Manpower, Methods, Material, Machines, Environment) with the 5 whys method, one can dig deeper to understand why a problem actually occurs.
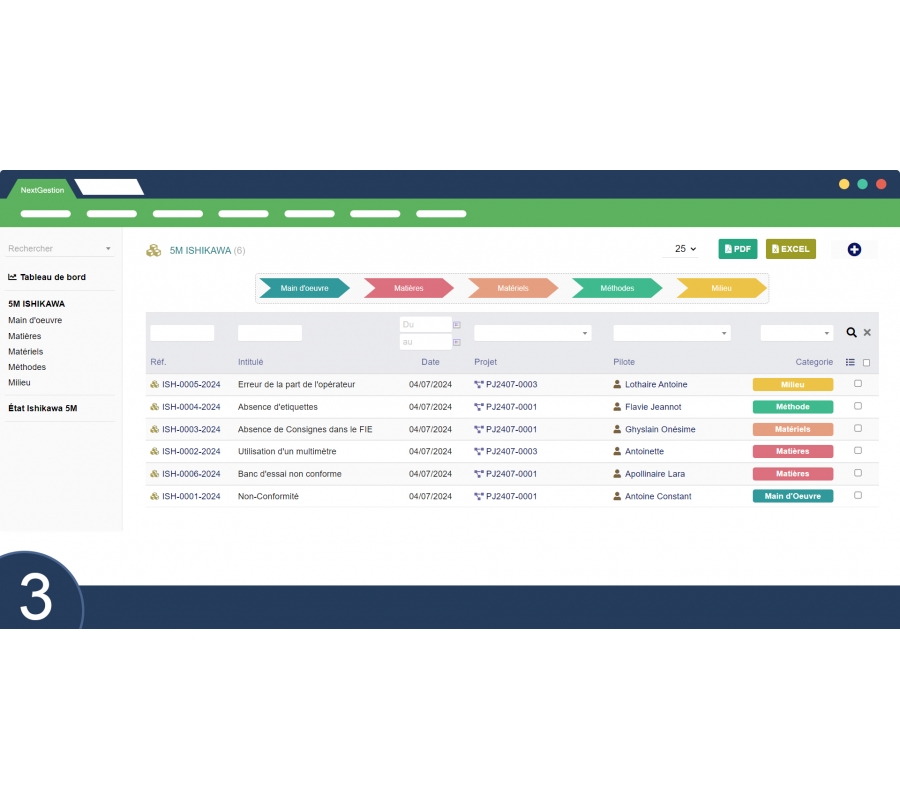
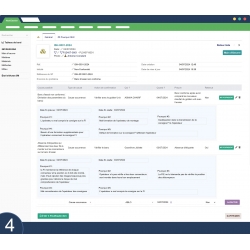
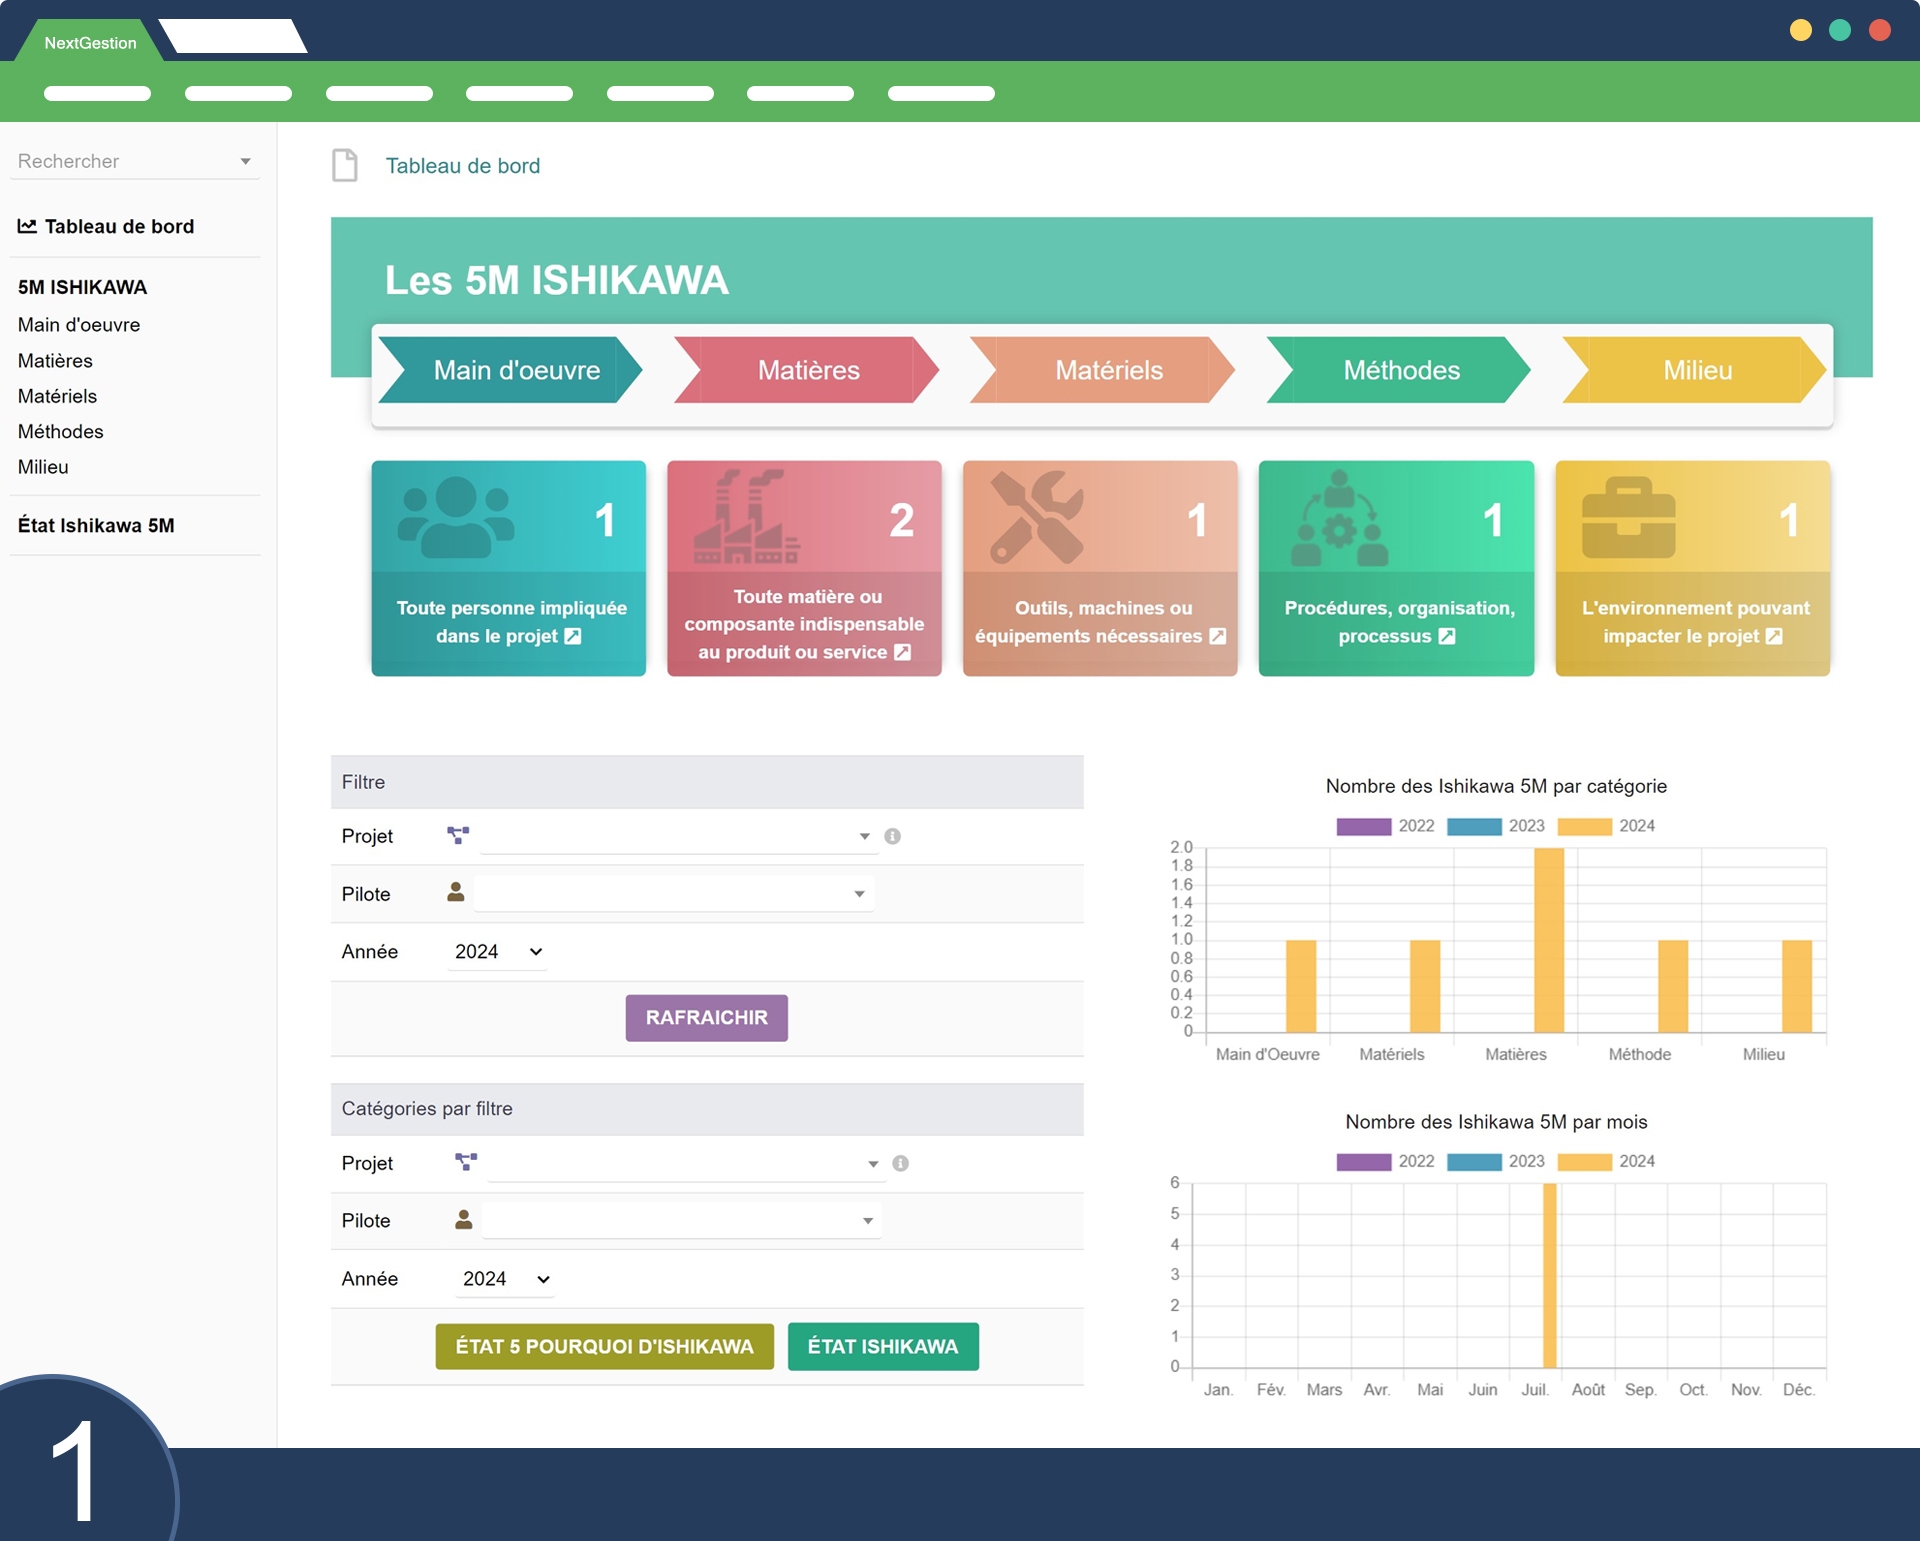
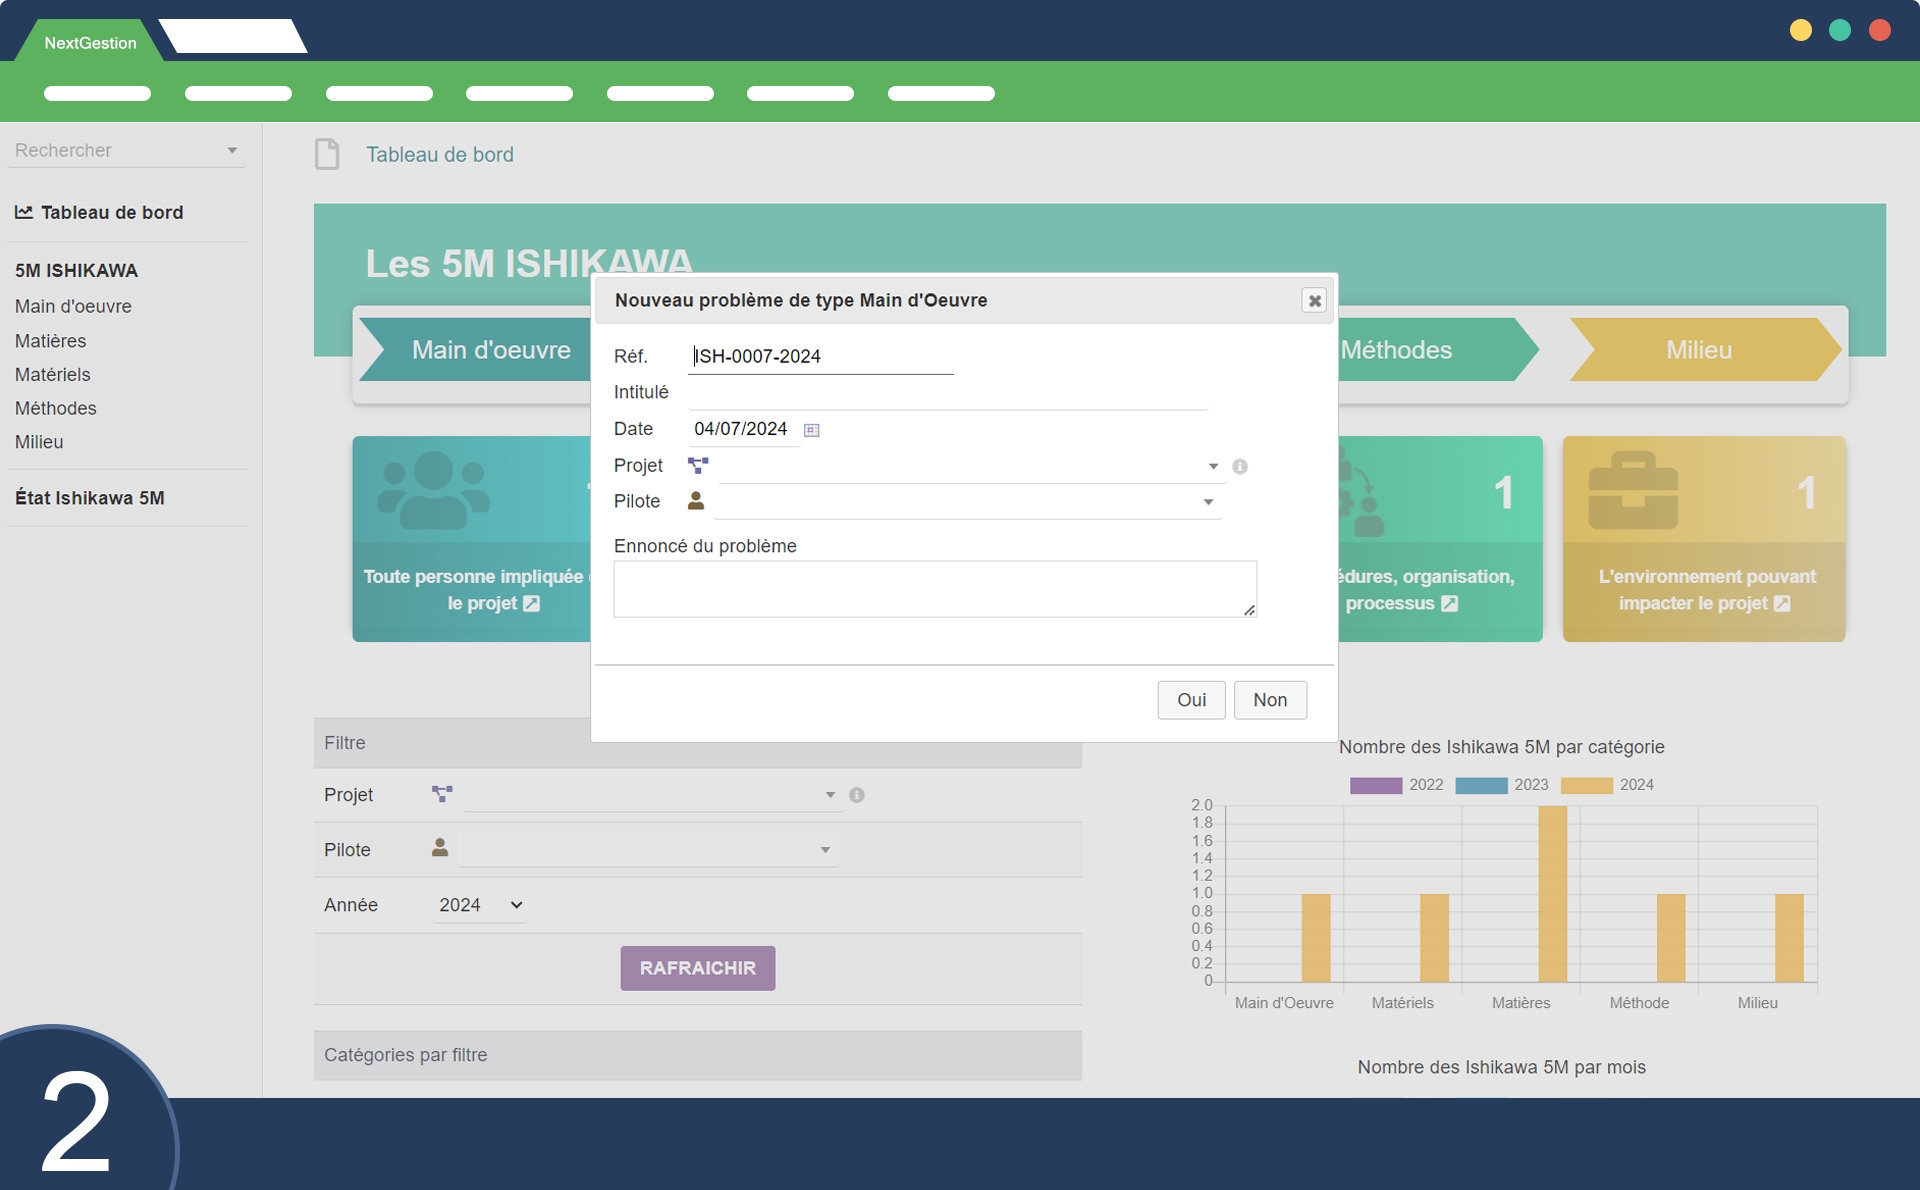
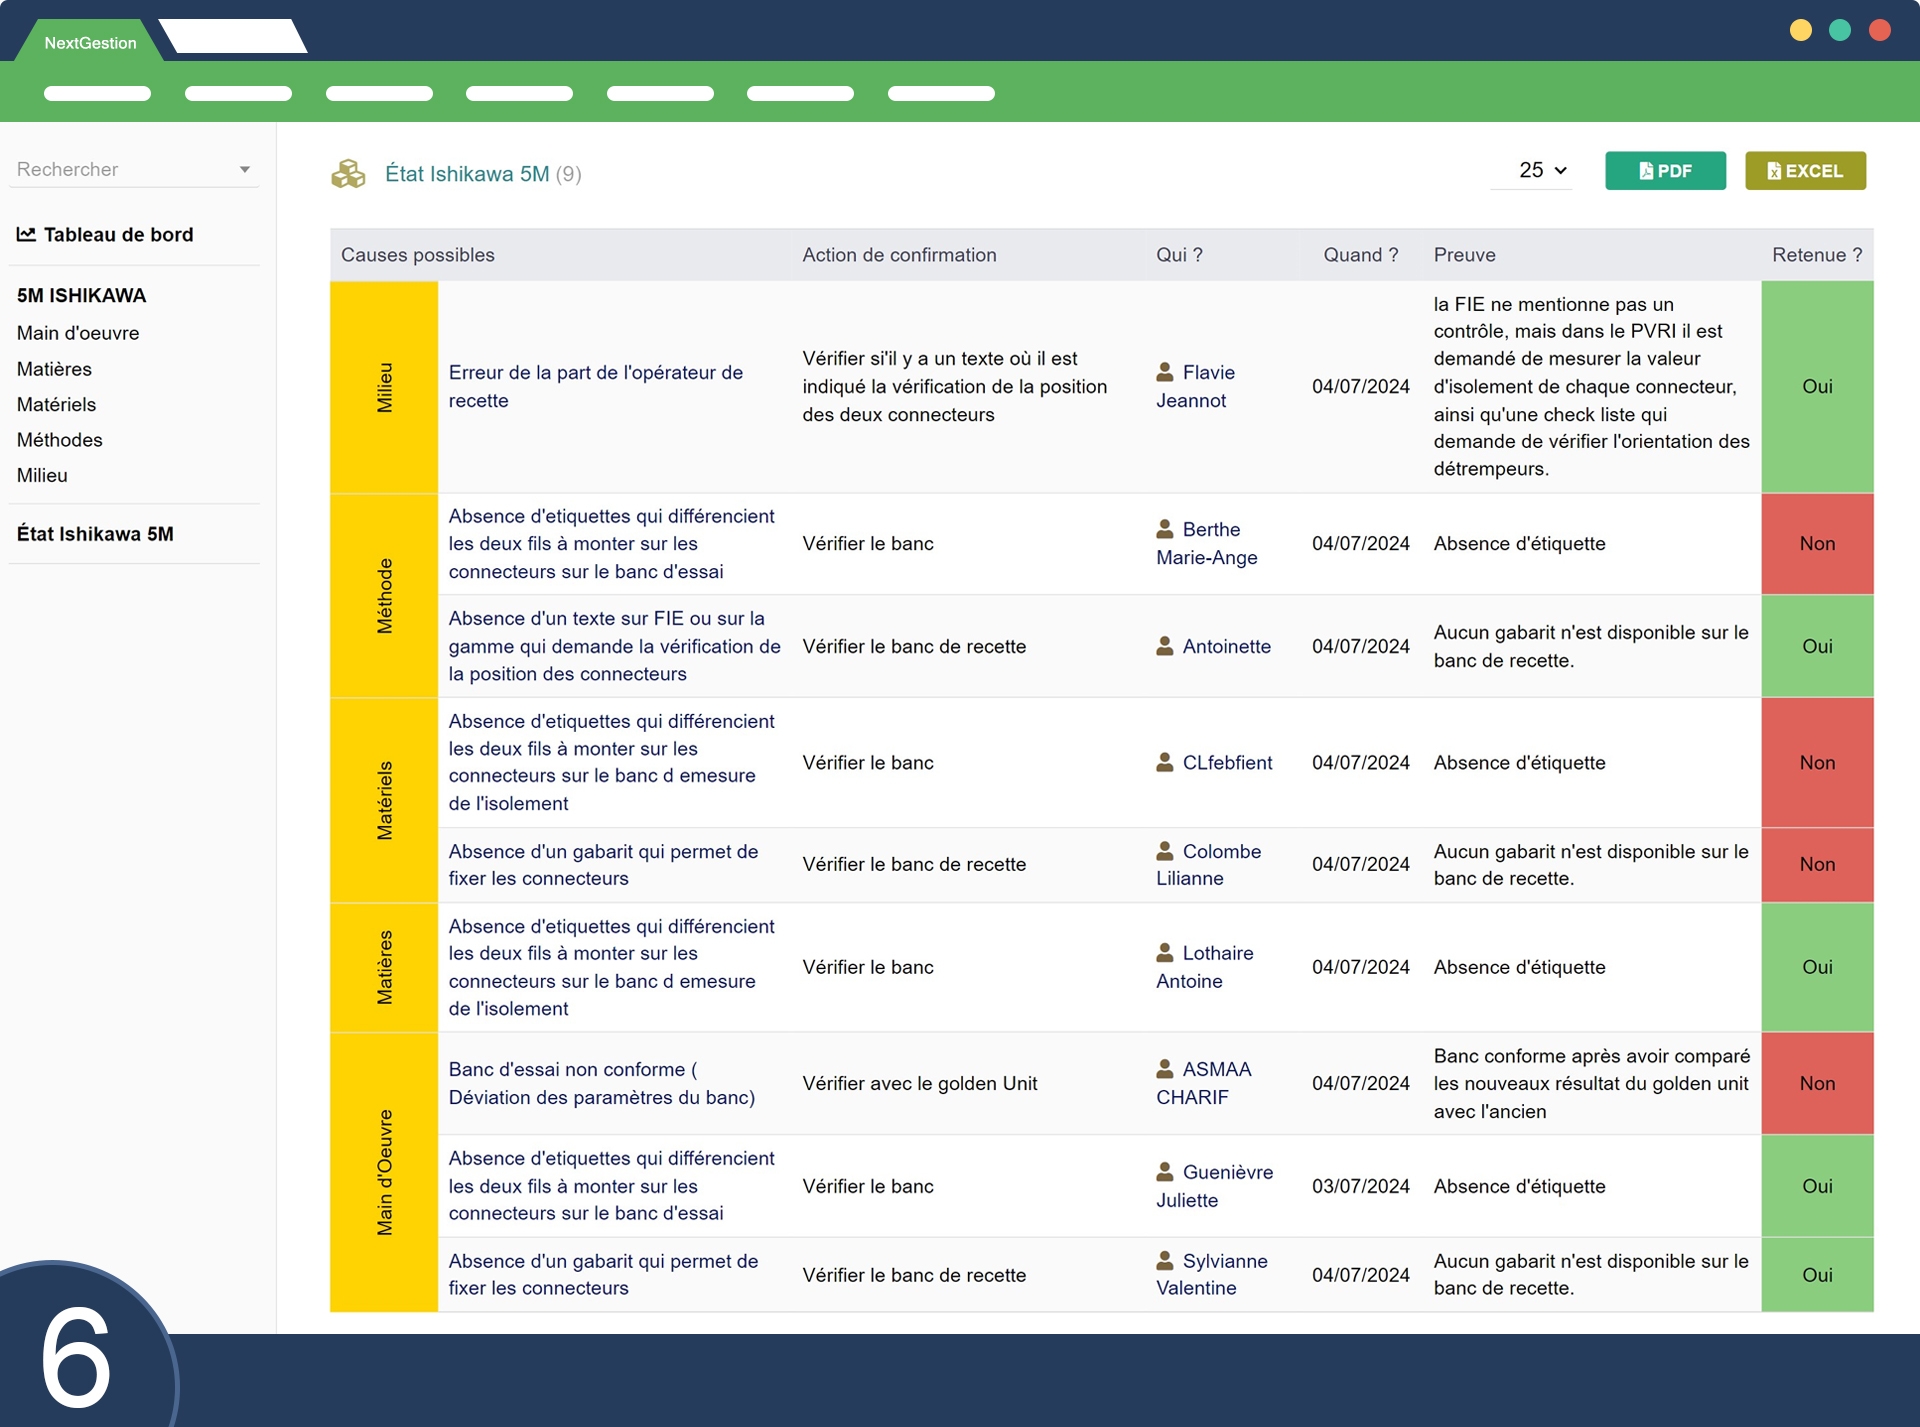
After identifying and filling in all the issues, you can now click on the buttons above to view the entire diagram. The basic chart shows only the top causes in each category. It's much clearer and more compact. But the expanded table also contains the indirect causes you discussed earlier.
You can choose the one that suits you best. Both reports and tables are printable and easy to use!
Feature Summary of 5M ISHIKAWA Fishbone Diagram Module:
Brainstorm and find the root causes
Create a fishbone cause and effect analysis
Ready for full printing
No customer reviews for the moment.